
My original paper chromatography lab used a kit of pure FD&C dye solutions. It works, but pure dyes don’t leave much to discover. This year I wanted something cheaper and more surprising, so I picked up a 3-pack of Crayola Food Colors. The back of the box gave away the twist: none of the three bottles is a single dye.
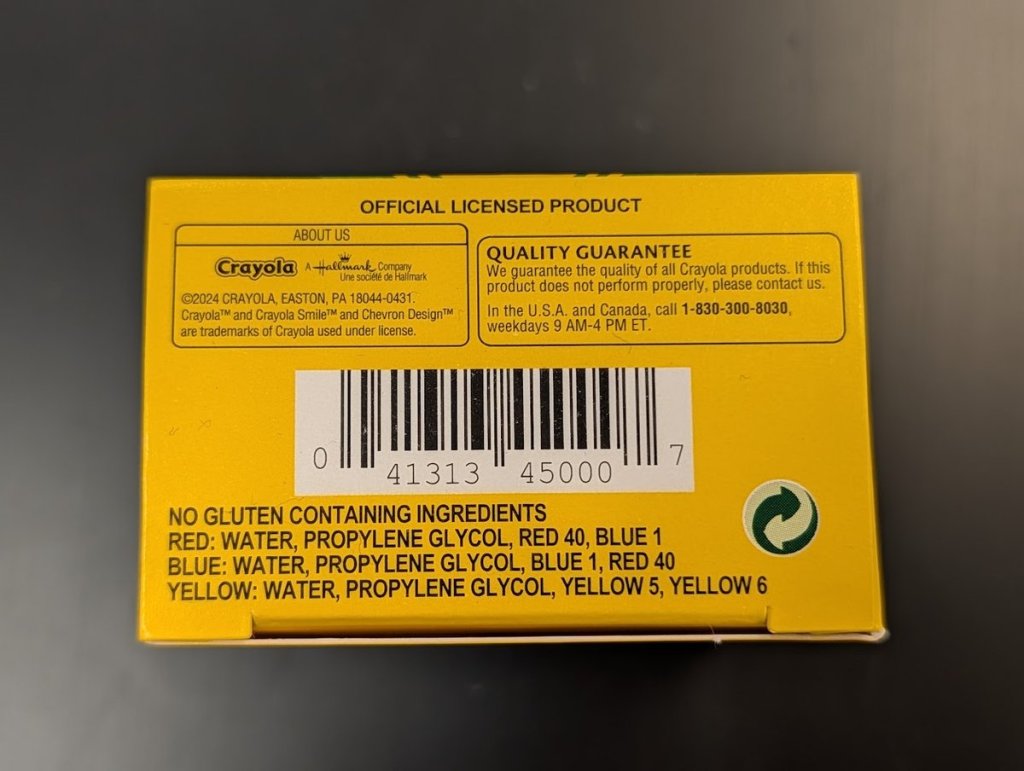
That makes the bottle color useless as a clue, which is exactly what you want in a separation lab. The only way to know what is in each bottle is to pull the dyes apart.
The Setup
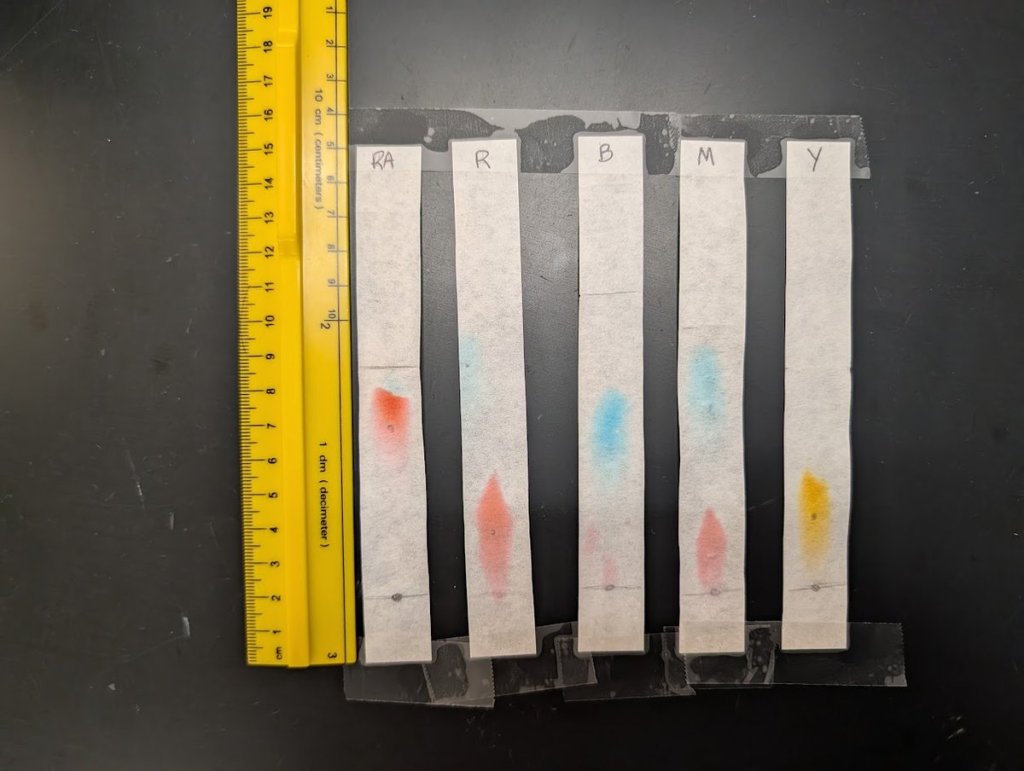
Each group runs five strips. R, B, and Y are the red, blue, and yellow bottles. M is a mystery sample I mix from two of the bottles; this one was red plus blue, which looks purple. RA is the red bottle again, run in 2% isopropyl alcohol instead of 2% salt water so the class can compare solvents.
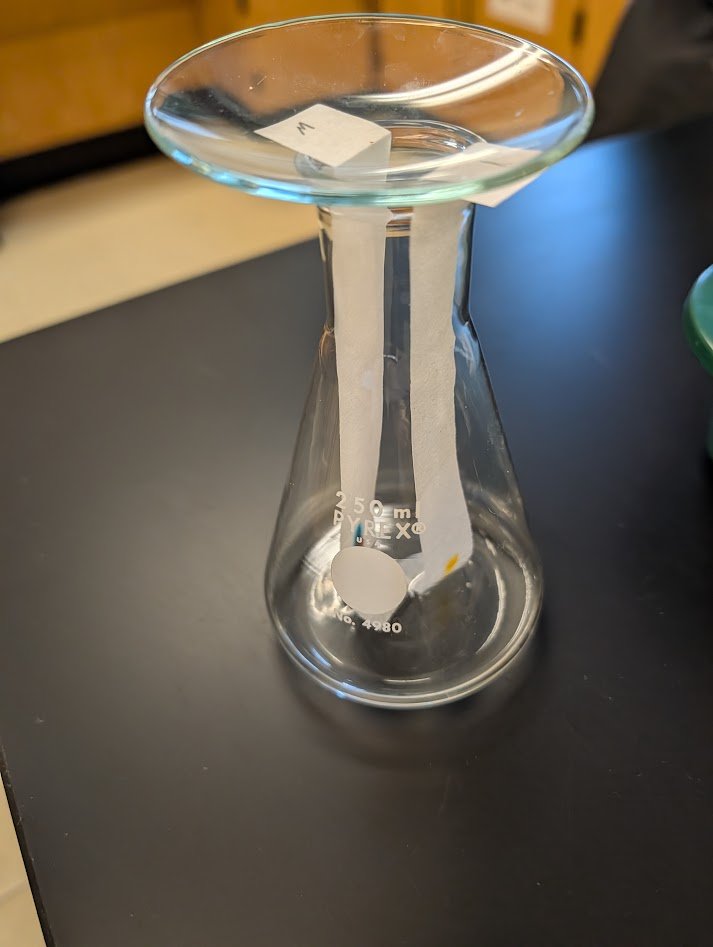
My favorite small fix: fold the top of each strip over the rim of a 250 mL Erlenmeyer flask, then set a watch glass on top. It pins the strips in place, keeps them from sliding down into the solvent, and slows evaporation, all with equipment every chemistry room already has.
The Results
The photo at the top of this post shows one full set of strips. From left to right: RA (2% isopropyl alcohol), then R, B, M, and Y (all in 2% salt water). I measured each band from that photo, using the ruler for scale. The retention factor, Rf, is the distance a band traveled divided by the distance the solvent traveled. The expected values are the reference values from the Flinn Scientific dye kit I used to use.
| Strip | Band | Expected Rf | Measured Rf |
|---|---|---|---|
| R (salt water) | Red 40 | 0.09 | 0.23* |
| R (salt water) | Blue 1, faint | 0.73 | 0.79* |
| B (salt water) | Blue 1 | 0.73 | 0.54 |
| B (salt water) | Red 40, faint | 0.09 | 0.10 |
| Y (salt water) | Yellow 5 and Yellow 6 | 0.26 and 0.20 | 0.27*, one band |
| M (salt water) | Blue 1 | 0.73 | 0.79 |
| M (salt water) | Red 40 | 0.09 | 0.16 |
| RA (alcohol) | Red 40 | 0.71 | 0.78 |
| RA (alcohol) | Blue 1, faint | 0.94 | about 0.94 |
What Matched
- The hidden dyes showed up. The red bottle left a faint blue band near the top of its strip, and the blue bottle left a faint pink smear near the start. That is exactly what the label promised.
- The mystery was solvable. Strip M has two strong bands, one red and one blue. Each bottle on its own gives only one strong band, so two strong bands means both bottles went in.
- Alcohol changed everything for Red 40. Its Rf jumped from about 0.1 to 0.2 in salt water to 0.78 in alcohol, close to the expected 0.71. The trace of Blue 1 rode right at the solvent front. Both dyes moved farther, but they ended up nearly on top of each other. Bigger Rf values, worse separation.
- The two yellows merged. Yellow 5 and Yellow 6 are expected at 0.26 and 0.20, too close to resolve on paper, and they came out as one band at about 0.27.
What Didn’t
- Red 40 ran high in salt water, at 0.16 and 0.23 instead of 0.09. Those red bands are long streaks, a sign the spots were overloaded. Bottled food color is concentrated, so one quick toothpick touch is plenty.
- Blue 1 disagreed with itself. On the B strip it came in low at 0.54, while the blue band on the mystery strip came in at 0.79. Same dye, but different spot sizes and different flasks. The colors and band order still matched, which is why chemists compare an unknown to standards run side by side.
- Two strips lost their solvent fronts. Once a strip dries, the front is gone for good. It has to be marked the moment the strip comes out of the flask.
Why It Works
Every band is the result of a tug-of-war. The paper is cellulose, which is covered in OH groups that hydrogen bond with the dyes and hold them back. The solvent pulls the other way. Blue 1 has more charged sulfonate groups and a bulky shape, so ion-dipole attractions keep it dissolved in the salt water and it travels far. Red 40 is flatter and has sites that hydrogen bond with cellulose, so the paper holds on to it. Isopropyl alcohol adds a nonpolar propyl group that forms London dispersion attractions with the dyes’ aromatic rings, so the solvent wins the tug-of-war for both dyes.
For the full background, see my AP Chemistry lesson on 3.9 Separation of Solutions and Mixtures.
Tweaks for Next Time
- Dilute each food color about 1:1 with water, or use a single toothpick touch, to keep bands tight.
- Mark the solvent front and a dot at the center of each band the second the strip comes out.
- Run the mystery strip in the same flask as the R and B strips, so it develops under the same conditions as the dyes it is compared to.
Try It Yourself
The lab runs over two days: students run the strips on day one, let them dry overnight, and measure and analyze on day two. Here are the handouts:
- Student Lab Procedure (PDF, 2 pages)
- Student Lab Packet with pre-lab questions, data tables, dye structures, and post-lab questions (PDF, 6 pages)
Feel free to use and adapt them under the site’s CC BY-NC-SA 4.0 license.

