
The video lesson for this topic is coming soon.
Essential Question
What can a position-time graph tell us about motion?
A single graph can show where an object is, whether it’s moving, which way it’s going, and how fast. By the end of this lesson, you should be able to describe motion from a position-time graph and find an object’s velocity from the slope.
Position-Time Graphs
- Position on the y-axis
- Time on the x-axis
- Each point: where and when
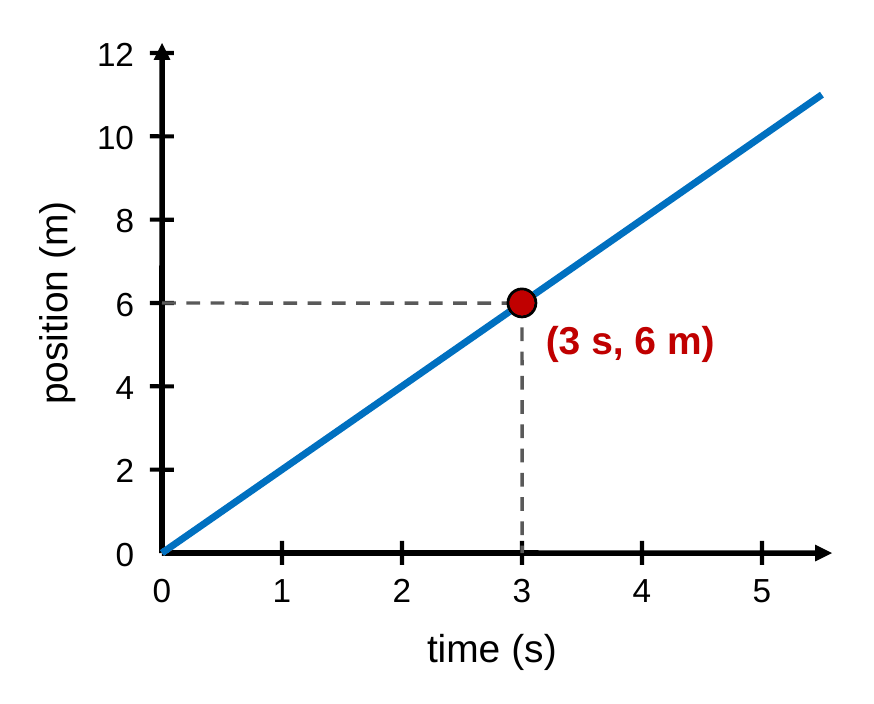
A position-time graph puts time on the x-axis and position on the y-axis. Every point on the line tells you where the object was at one moment. The marked point shows that at 3 s, the object was at a position of 6 m.
At Rest
- Horizontal (flat) line
- Position isn’t changing
- Velocity = 0 m/s
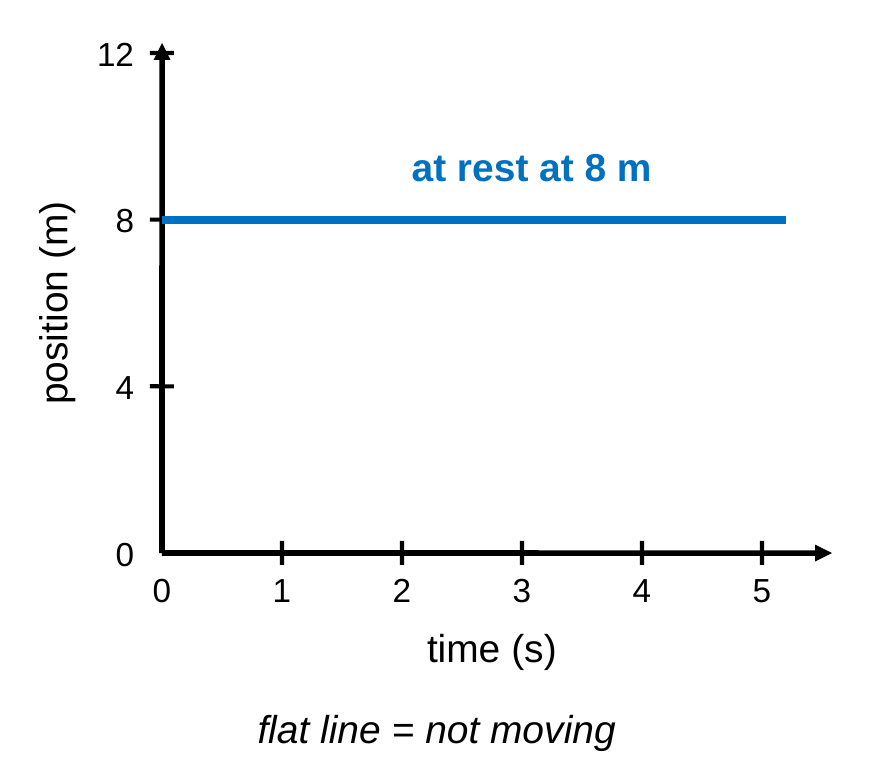
A horizontal line means the position stays the same as time goes by, so the object is at rest and its velocity is 0 m/s. Notice the object is not at 0 m. It is sitting still at 8 m. A flat line means not moving, no matter how high or low it is.
Constant Velocity
- Straight, sloped line
- Steeper line = faster
- Same Δx every second
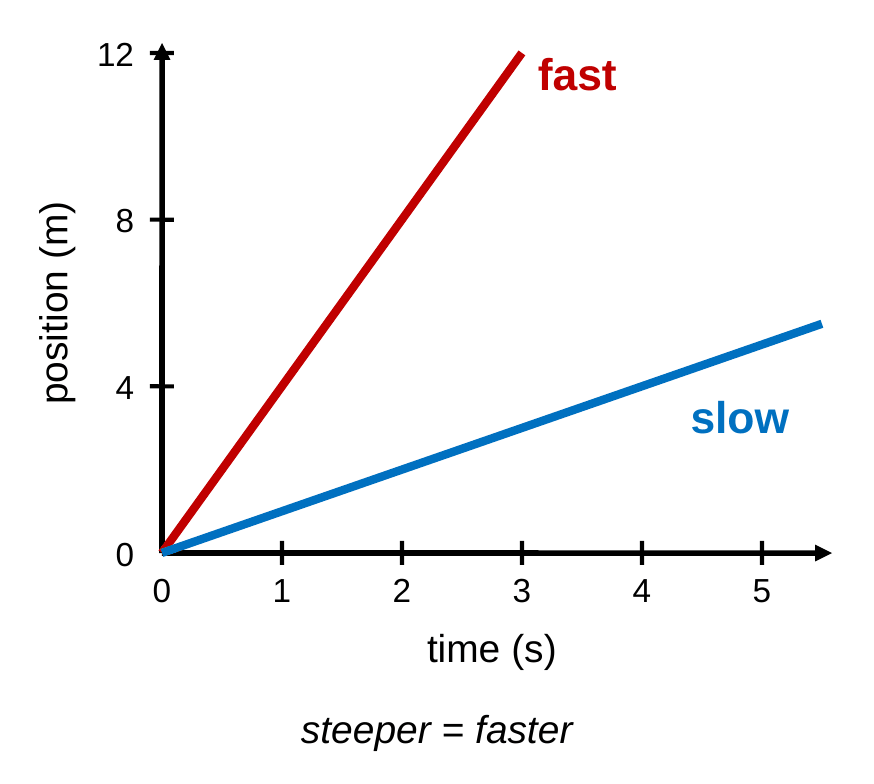
A straight, sloped line means the object moves the same distance every second, so it has a constant velocity. The steeper the line, the faster the object. The red object covers 12 m in 3 s (4 m/s), while the blue object takes much longer to cover the same distance.
Direction of Motion
- Line goes up: moving + way
- Line goes down: moving − way
- Down toward 0: heading back
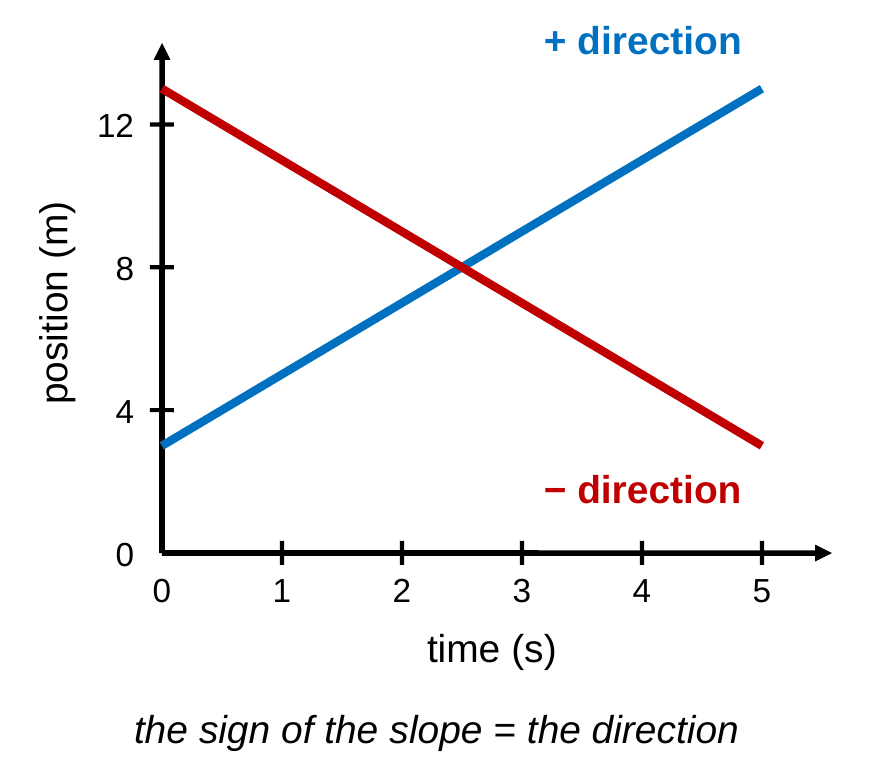
The direction a line slopes tells you the direction of motion. A line that rises (positive slope) means the position is increasing, so the object moves in the positive direction. A line that falls (negative slope) means the position is decreasing, so the object moves in the negative direction, back toward the reference point.
Slope = Velocity
- Rise = Δx (meters)
- Run = Δt (seconds)
- Slope = Δx/Δt = v
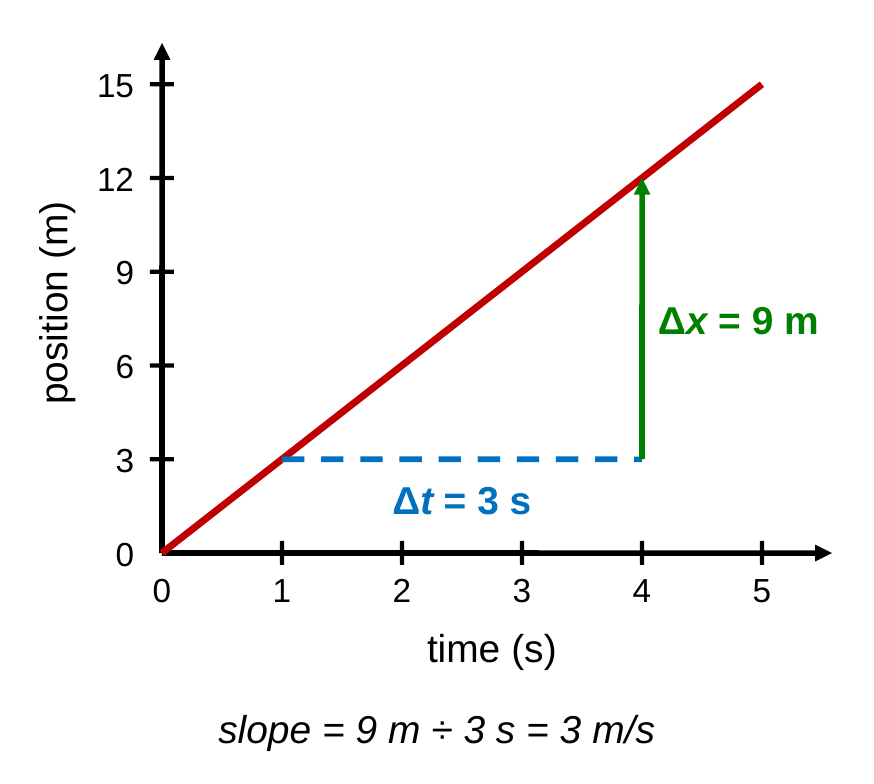
The slope of a position-time graph is the rise over the run. The rise is the change in position, Δx, and the run is the change in time, Δt. That is exactly the velocity equation, v = d/t. So the slope of a position-time graph is the object’s velocity, and its units are m/s. Here the position rises 9 m in 3 s, so the velocity is 3 m/s.
Speeding Up and Slowing Down
- Curved line: velocity changing
- Getting steeper: speeding up
- Getting flatter: slowing down
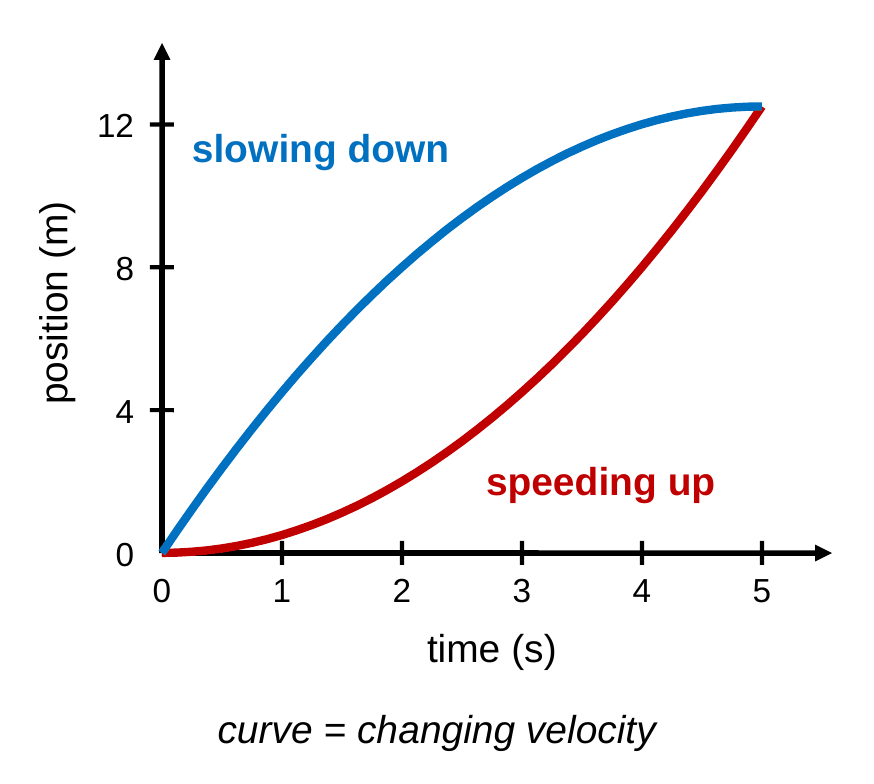
When the velocity changes, the slope changes, so the line curves. A curve that gets steeper as time goes on means the object is speeding up. A curve that gets flatter means the object is slowing down. Both objects here end up at the same place at the same time, but they get there in very different ways.
Worked Examples
Try each problem on your own first, then check your work against the solution.
Example 1: Describing Motion
Describe the motion of the object during sections A, B, and C of the graph. Section A runs from 0 m to 12 m between 0 s and 4 s, section B stays at 12 m from 4 s to 6 s, and section C returns from 12 m to 0 m between 6 s and 10 s.
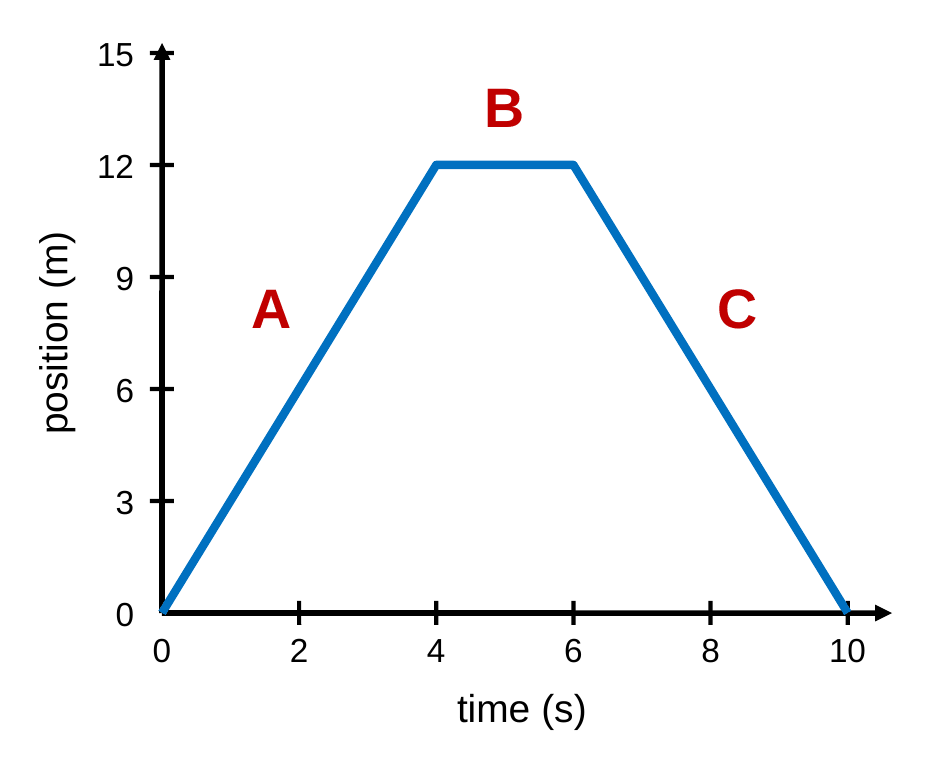
- Section A: straight line going up: constant velocity in the positive direction. Slope = 12 m / 4 s = 3 m/s
- Section B: flat line: at rest at 12 m for 2 s, velocity = 0 m/s
- Section C: straight line going down: constant velocity in the negative direction. Slope = −12 m / 4 s = −3 m/s
- Answer: A: moves away at a steady 3 m/s. B: stops at 12 m for 2 s. C: returns to the start at a steady 3 m/s.
Example 2: Velocity from Slope
A cart’s position-time graph is a straight line from (0 s, 5.0 m) to (5.0 s, 20.0 m). What is the cart’s velocity?
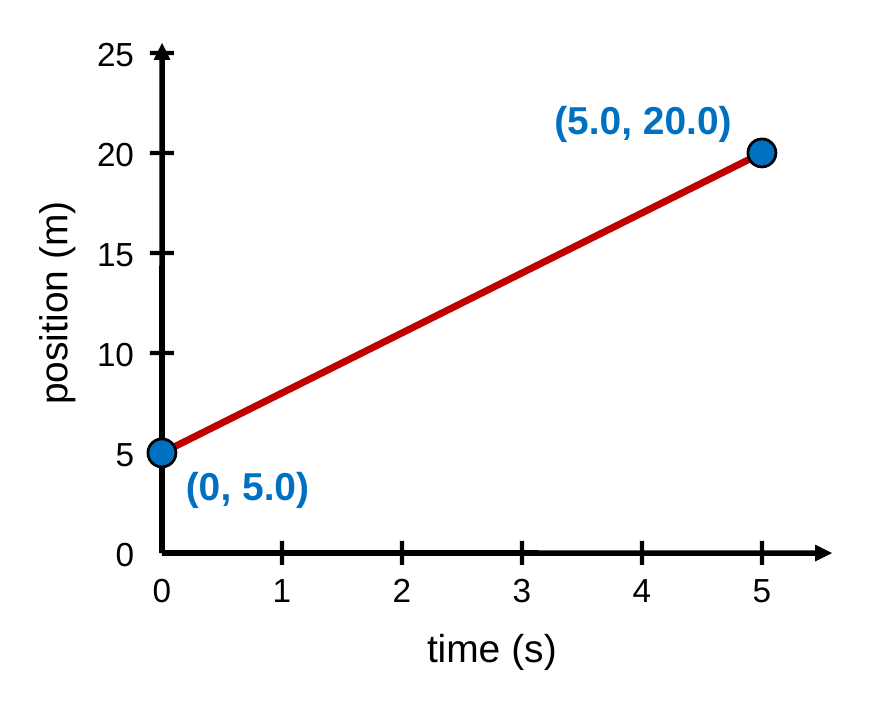
- Rise: Δx = 20.0 m − 5.0 m = 15.0 m
- Run: Δt = 5.0 s − 0 s = 5.0 s
- Slope: v = Δx/Δt = 15.0 m / 5.0 s
- Answer: v = 3.0 m/s in the positive direction
Example 3: Negative Slope
A toy car’s position-time graph is a straight line from (0 s, 20.0 m) to (8.0 s, 4.0 m). Find the car’s velocity.
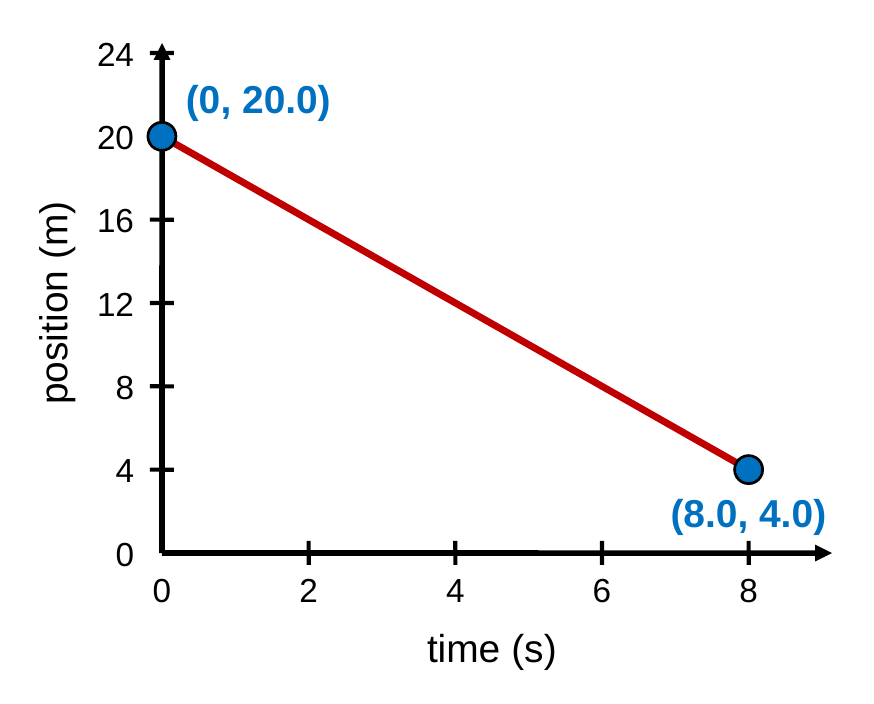
- Rise: Δx = 4.0 m − 20.0 m = −16.0 m
- Run: Δt = 8.0 s − 0 s = 8.0 s
- Slope: v = Δx/Δt = −16.0 m / 8.0 s
- Answer: v = −2.0 m/s, so 2.0 m/s in the negative direction, back toward the reference point
Example 4: Extrapolating
A toy robot’s position-time graph is a straight line through (0 s, 2.0 m) and (4.0 s, 4.0 m). If it keeps the same velocity, where will it be at 12.0 s?
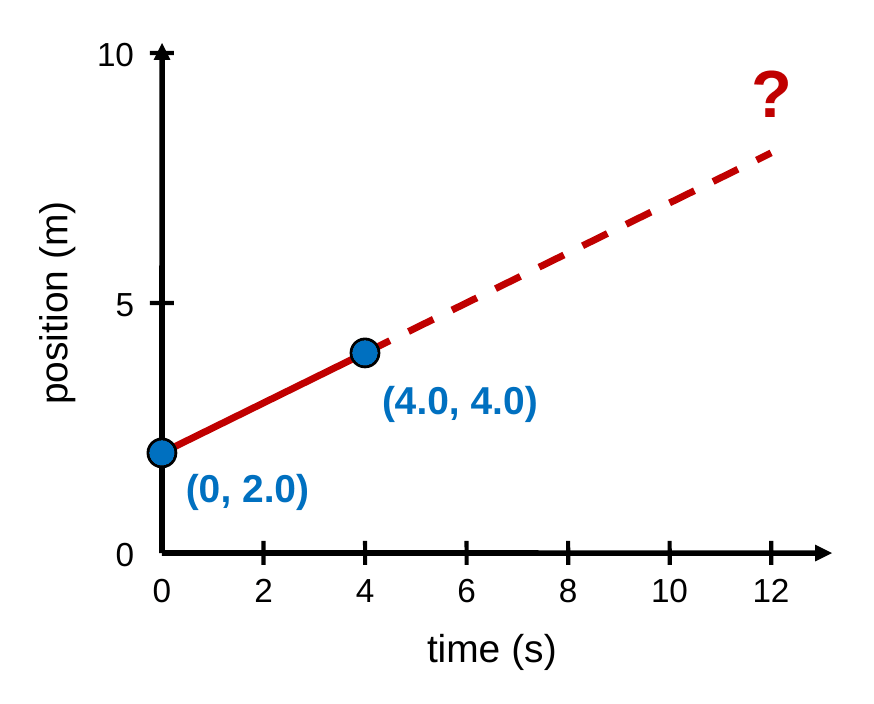
- Velocity (slope): v = (4.0 m − 2.0 m) / (4.0 s − 0 s) = 2.0 m / 4.0 s = 0.50 m/s
- Displacement: Δx = vt = (0.50 m/s)(12.0 s) = 6.0 m
- Add the starting position: x = 2.0 m + 6.0 m
- Answer: x = 8.0 m
This is extrapolating: the data stopped at 4.0 s, so the answer assumes the robot keeps moving at the same steady velocity.
Big Ideas
- Flat line: at rest (v = 0)
- Straight sloped line: constant velocity
- Slope = velocity, and its sign = direction
- Curved line: speeding up or slowing down
Back to the essential question: a position-time graph shows where an object is at every moment. A flat line means the object is at rest, a straight sloped line means constant velocity, and a curved line means the velocity is changing. The slope of the line is the velocity, and its sign gives the direction. Next up, we’ll look at what it means for velocity to change, in Acceleration.

