
The video lesson for this topic is coming soon.
Essential Question
What can a velocity-time graph tell us about motion?
Velocity-time graphs look a lot like position-time graphs, but they tell a different story. By the end of this lesson, you should be able to describe motion from a velocity-time graph, find acceleration from its slope, and find displacement from the area under the line.
Velocity-Time Graphs
- Velocity on the y-axis
- Time on the x-axis
- Shows how velocity changes
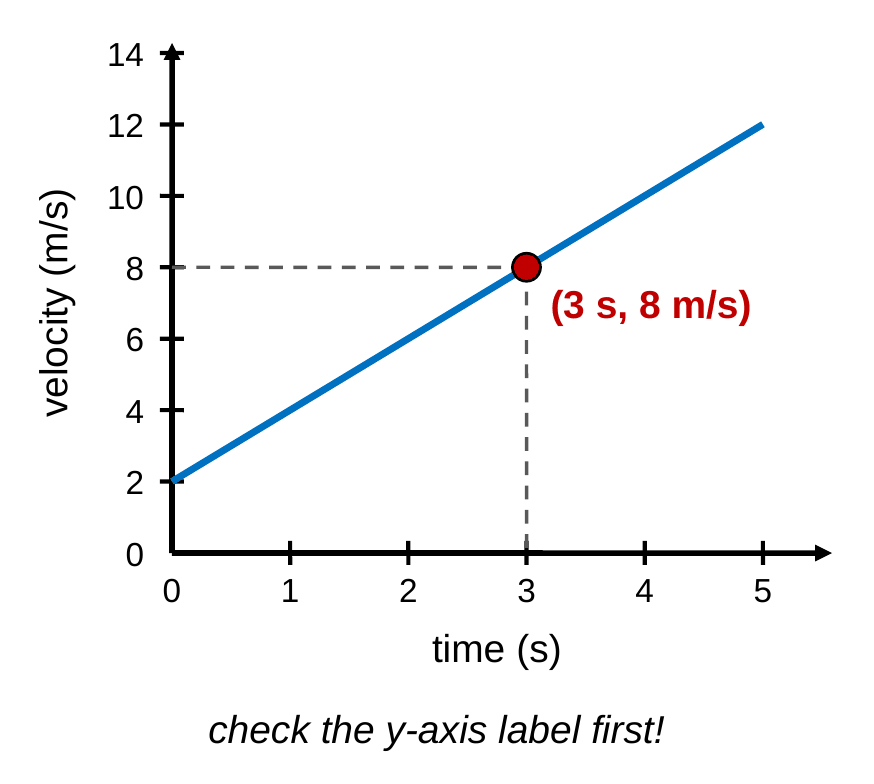
A velocity-time graph puts time on the x-axis and velocity on the y-axis. Each point tells you how fast, and in which direction, the object was moving at one moment. The marked point shows a velocity of 8 m/s at 3 s. Always check the y-axis label first, because a velocity-time graph and a position-time graph can look identical but mean very different things.
Constant Velocity
- Horizontal (flat) line
- Velocity isn’t changing
- Acceleration = 0
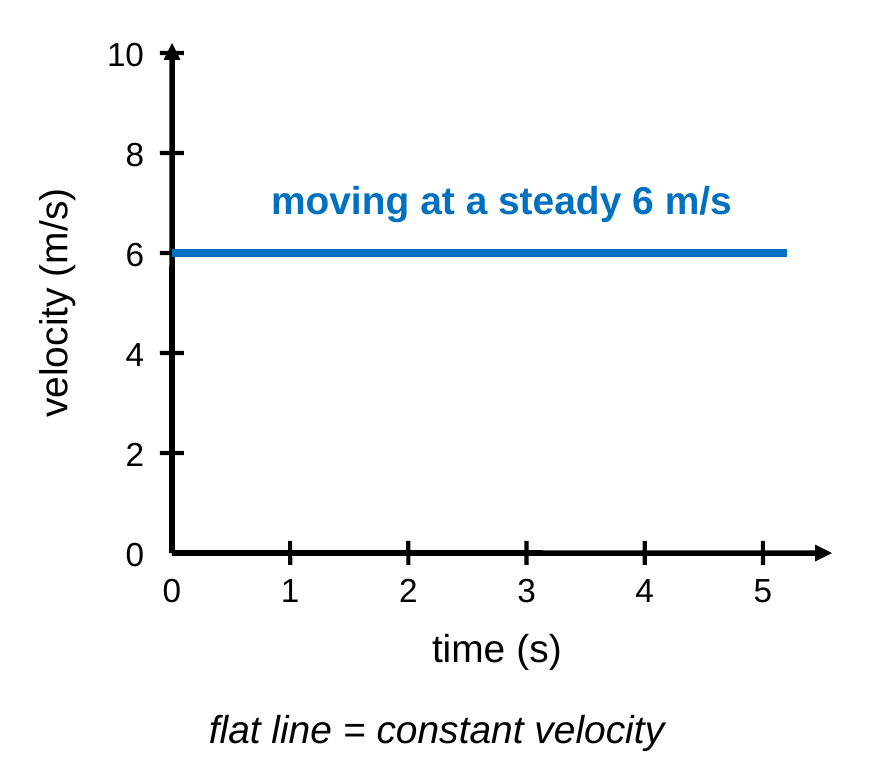
A horizontal line on a velocity-time graph means the velocity stays the same, so the object moves at a constant velocity and its acceleration is zero. This is different from a position-time graph, where a flat line means the object is at rest. Here the object keeps moving at 6 m/s the whole time. Only a flat line along v = 0 means at rest.
Slope = Acceleration
- Rise = Δv (m/s)
- Run = Δt (s)
- Slope = Δv/Δt = a
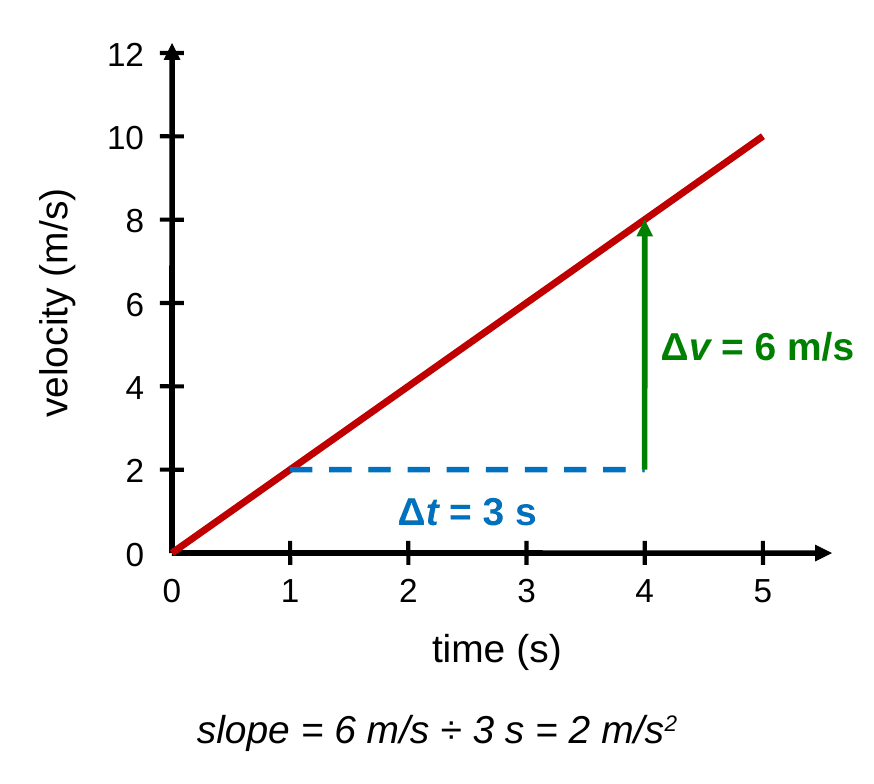
On a velocity-time graph, the rise is the change in velocity, Δv, and the run is the change in time, Δt. Rise over run is Δv/Δt, which is the definition of acceleration. So the slope of a velocity-time graph is the acceleration, in m/s2. Here the velocity rises 6 m/s in 3 s, so the acceleration is 2 m/s2.
Speeding Up and Slowing Down
- Line moves away from 0: speeding up
- Line moves toward 0: slowing down
- Steeper = bigger acceleration
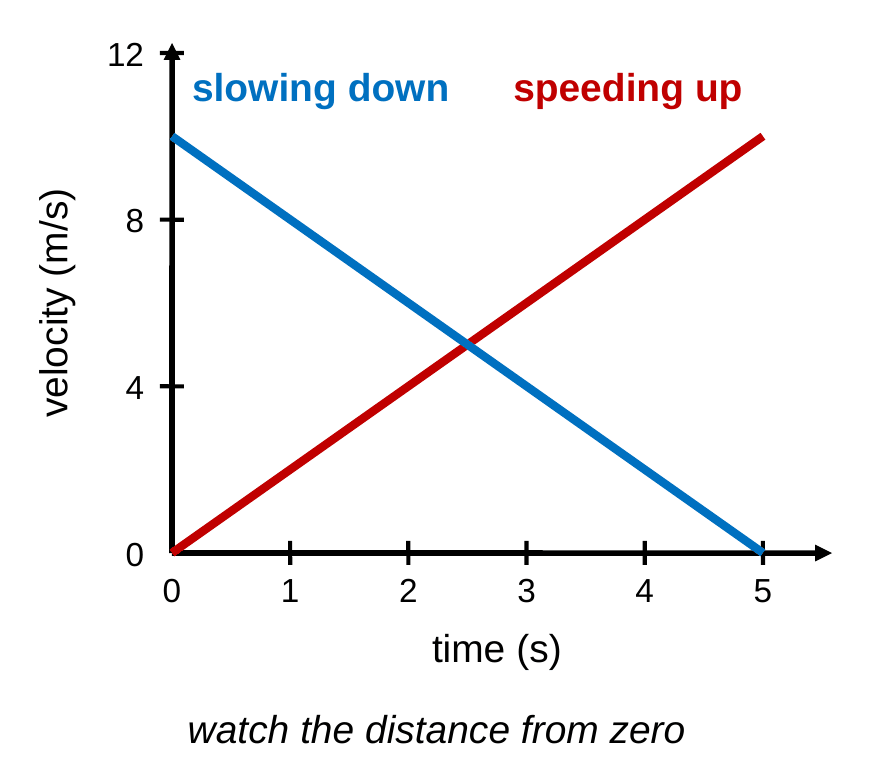
Speed is how far the line is from zero, so look at whether the line moves away from or toward the time axis. The red line moves away from zero, so the object speeds up. The blue line moves toward zero, so the object slows down, and it stops when the line reaches v = 0. A steeper line means a larger acceleration.
Area = Displacement
- Area between line and time axis
- Rectangle: v × t
- Triangle: ½ × base × height
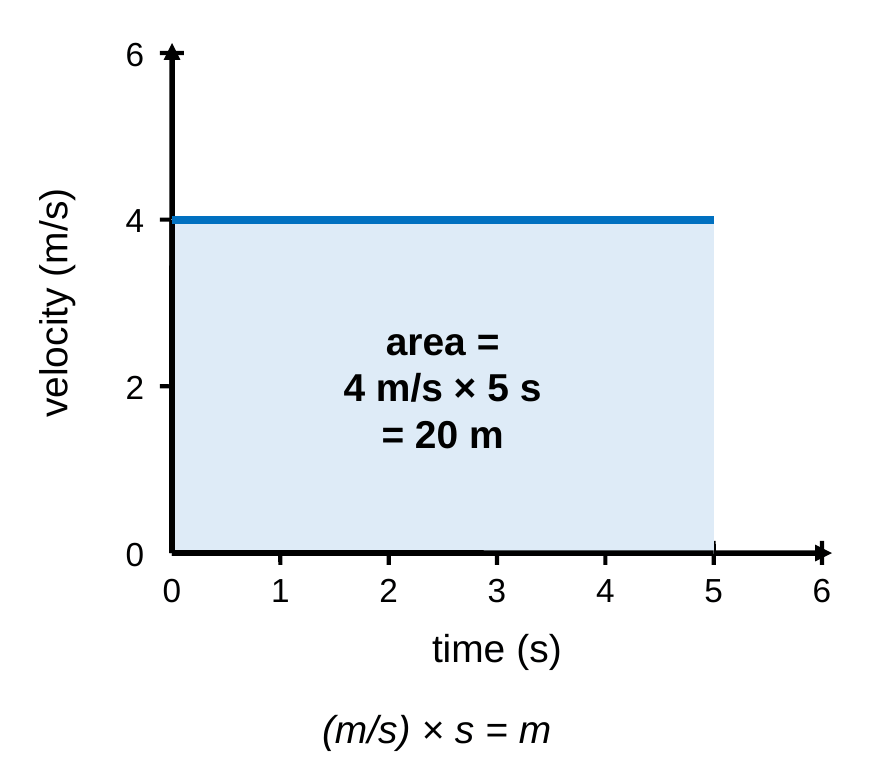
The area between the line and the time axis on a velocity-time graph equals the displacement. For a flat line, the area is a rectangle: height (velocity) times width (time). Here, 4 m/s × 5 s = 20 m, which matches d = vt. If the line slopes, the area is a triangle, so use ½ × base × height. The units work out because (m/s) × s = m.
Extrapolating
- Extend the straight line
- Predict a future velocity
- Line hits v = 0: it stops
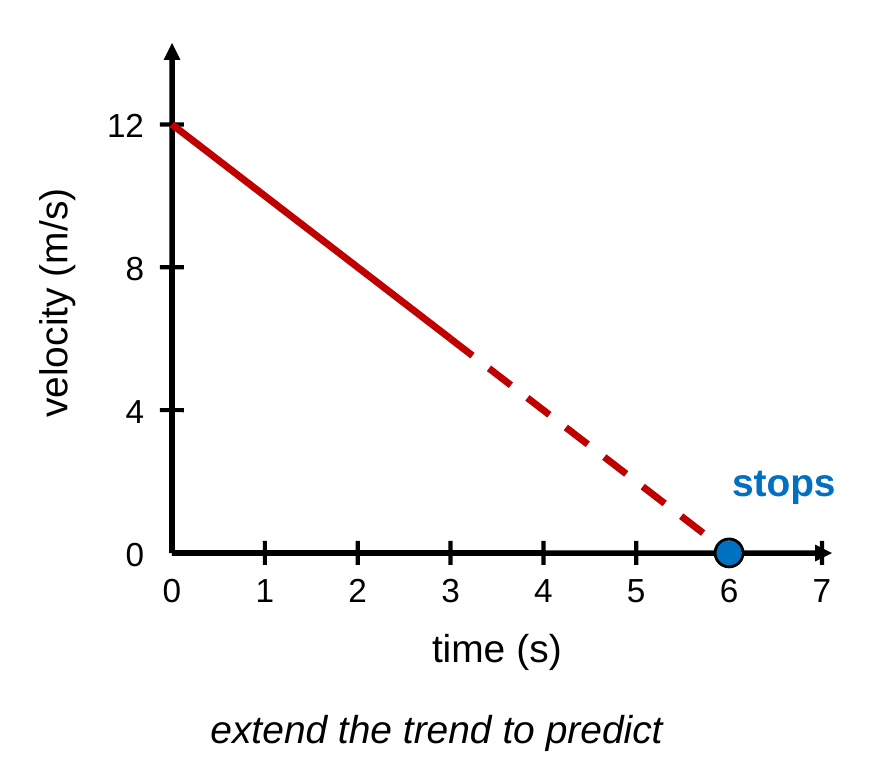
If the line on a velocity-time graph is straight, the acceleration is constant, so you can extend the line to predict future velocities. This object loses 2 m/s every second. Extending the line shows it will reach 0 m/s, and stop, at 6 s. Like any extrapolation, this assumes the acceleration stays the same.
Worked Examples
Try each problem on your own first, then check your work against the solution.
Example 1: Describing Motion
Describe the motion during sections A, B, and C, and find the acceleration in each section. Section A rises from 0 m/s to 8 m/s between 0 s and 4 s, section B stays at 8 m/s from 4 s to 8 s, and section C falls from 8 m/s to 0 m/s between 8 s and 10 s.
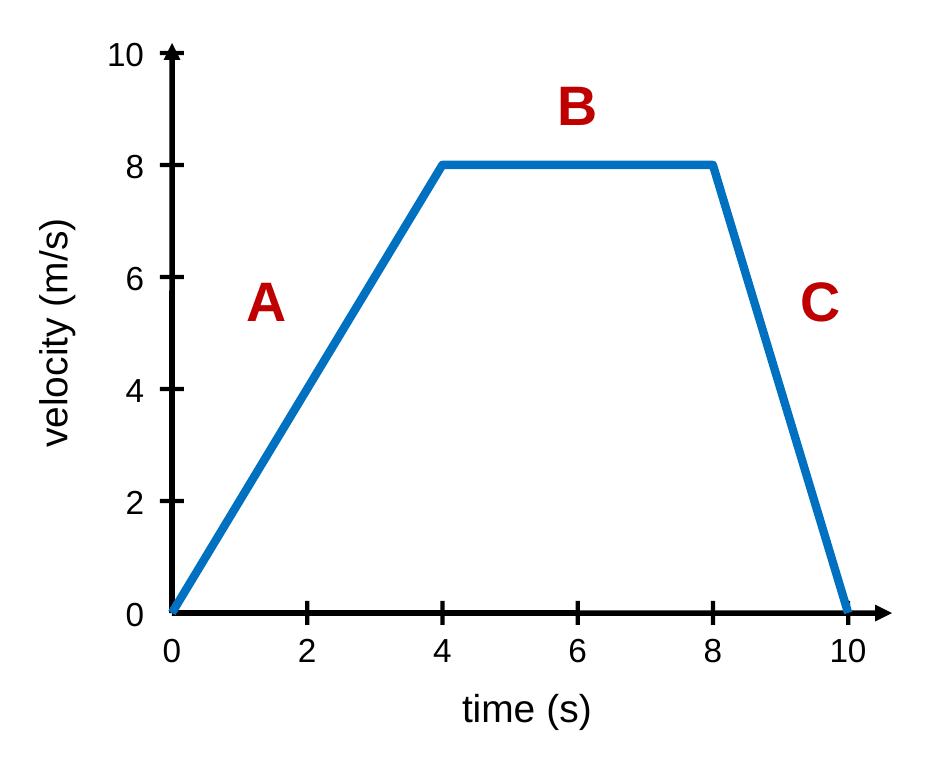
- Section A: line moves away from zero, so the object speeds up. a = (8 m/s − 0 m/s) / 4 s = 2 m/s2
- Section B: flat line, so the object moves at a constant 8 m/s. a = 0 m/s2
- Section C: line moves toward zero, so the object slows down and stops at 10 s. a = (0 m/s − 8 m/s) / 2 s = −4 m/s2
- Answer: A: speeds up at 2 m/s2. B: cruises at 8 m/s (a = 0). C: slows down at −4 m/s2 and stops.
Example 2: Finding Acceleration
A car’s velocity-time graph is a straight line from (0 s, 4.0 m/s) to (6.0 s, 16.0 m/s). What is the car’s acceleration?
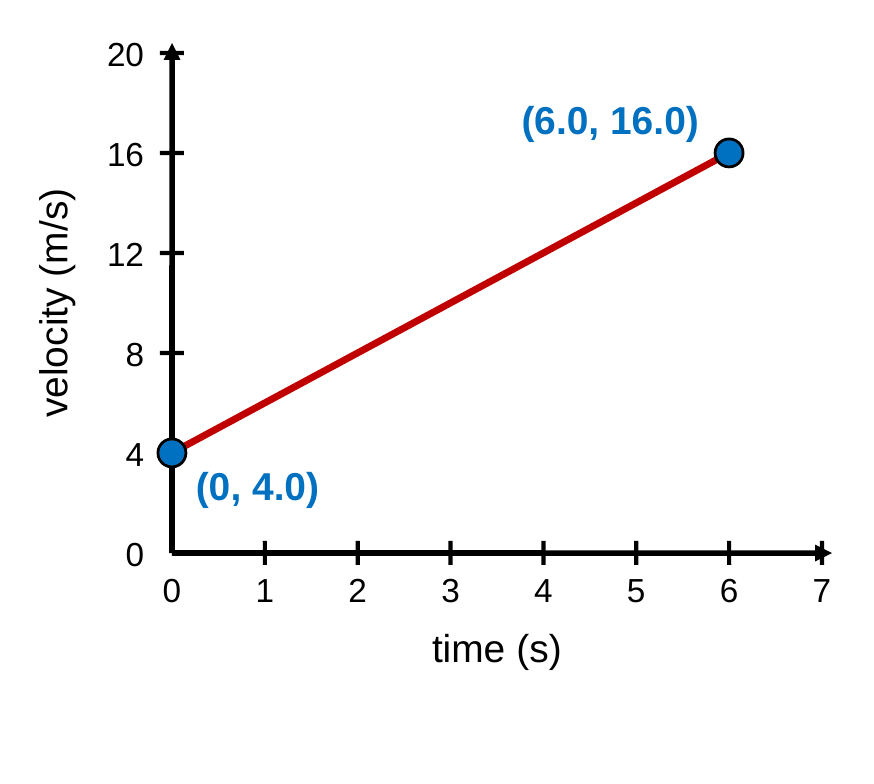
- Rise: Δv = 16.0 m/s − 4.0 m/s = 12.0 m/s
- Run: Δt = 6.0 s − 0 s = 6.0 s
- Slope: a = Δv/Δt = 12.0 m/s / 6.0 s
- Answer: a = 2.0 m/s2
Example 3: Area of a Rectangle
A bus moves at a constant 6.0 m/s for 5.0 s. Use the area under its velocity-time graph to find its displacement.
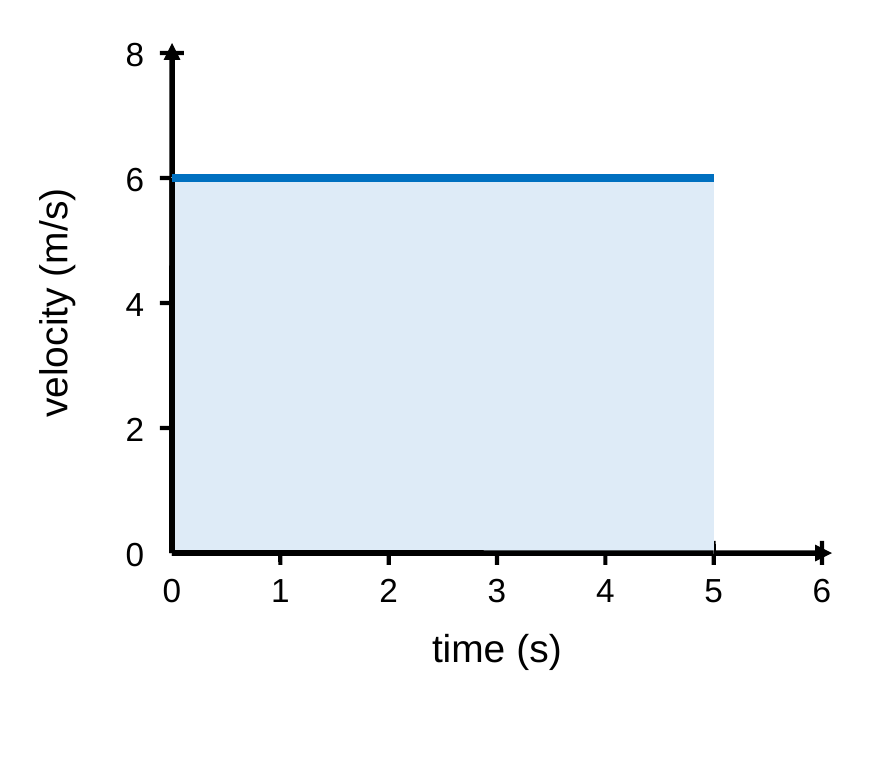
- Shape: the area under a flat line is a rectangle
- Area formula: area = height × width = v × t
- Substitute: area = (6.0 m/s)(5.0 s). The seconds cancel, leaving meters.
- Answer: d = 30. m
Example 4: Area of a Triangle
A sprinter speeds up from rest to 12 m/s in 4.0 s. Use the area under her velocity-time graph to find her displacement.
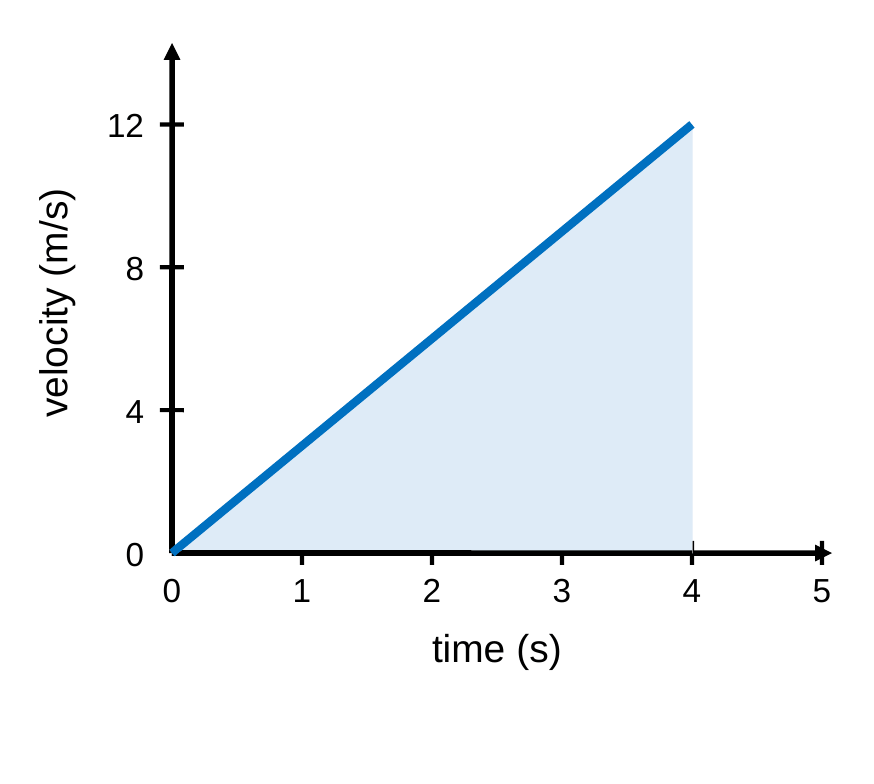
- Shape: the line rises from 0 m/s, so the area under it is a triangle
- Area formula: area = ½ × base × height = ½ × t × v
- Substitute: area = ½ × (4.0 s) × (12 m/s)
- Answer: d = 24 m
Common mistake: using d = vt with 12 m/s gives 48 m, which is twice too big. She was only going 12 m/s at the very end.
Big Ideas
- Flat line: constant velocity (a = 0)
- Slope = acceleration
- Area under the line = displacement
- Away from 0: speeding up. Toward 0: slowing down
Back to the essential question: a velocity-time graph shows how fast an object moves, and which way, at every moment. A flat line means constant velocity, the slope of the line is the acceleration, and the area between the line and the time axis is the displacement. Next up, we’ll put all of these ideas together into four equations, in Kinematic Equations.

